Without concrete goals, UX Metrics are impossibly difficult to define.
Not only that, but when they aren’t identified, defined, and monitored with the support of our demanding stakeholders, we inevitably revert to tracking business KPIs that give us nothing actionable and tell us very little about what impact we’re having on the lives of our customers.
This is the exact problem that Google User Researchers – Kerry Rodden, Hilary Hutchinson, and Xin Fu – set out to solve by developing the HEART Framework.
In this article, we give some concrete steps and actionable advice on how you can measure the impact of your user experience and get some data to help influence the product roadmap.
What is the HEART Framework, and Why Should We Care?
Metrics for tracking progress toward achieving business goals have been well-established for a long time. We have no problem defining business goals and identifying the signals that indicate whether or not we’re on the right path.
And rightly so, if the business doesn’t make money, none of us get paid.
However, since business goals are more tangible than current UX metrics, they’re often pointed to as more reliable and more worthy of our time and attention.
But, focusing on these metrics exclusively gives us a narrow view of success and often provides us with insights that are so broad that they aren’t actionable.
Measuring business metrics alone gives us a narrow view that doesn’t provide actionable insights for UX.
While they’re good indicators of business success, they’re very poor at giving us specific insights about user’s actual experiences that can inform our future design decisions.
Currently, within the field of UX Research, we tend to focus more on formative research that helps us to understand our users, define problems, and validate our design decisions in order to give us confidence ahead of committing resources to develop products.
But when it comes to tracking the success of our designs once they get into the user’s hands, we’re far less advanced in our thinking.
If our early research is done right and we’ve tested our designs properly, we just have to trust that once they get into customer’s hands, they’ll be successful.
Google’s HEART Framework attempts to solve this by encouraging us to track a range of metrics drawing from quantitative and qualitative sources across a few key aspects of the user experience.
The Google HEART UX Metrics framework consists of five dimensions:
- Happiness: How happy are users with the overall experience?
- Engagement: How engaged are users with the site or app?
- Adoption: How effectively are users able to start using the site or app?
- Retention: How well is the site or app retaining users over time?
- Task Success: How successful are users in completing tasks on the site or app?
Each dimension of the HEART framework encourages us to think about a different aspect of the user experience.
While not all dimensions will be relevant to every project, they act as a prompt for us to discuss with stakeholders to cause deeper thinking about our own specific needs.
It’s important to note that the HEART Framework isn’t meant to replace any existing methods of forming, evaluating, and tracking user experiences. It’s meant as a compliment to these sources so that we have a more well-rounded view of how our designs are performing.
Here Are Some Specific Examples of HEART Metrics for Your Inspiration
All this talk about the theory of UX metrics is all good, but what does it actually mean?
How can you track each of these dimensions in a way that provides valuable insight to your design team?
Well, because this is just a framework, and it can be applied across a range of products in various different industries, it’s up to you to do the work to figure out what each dimension means to you.
Plus, the framework can be applied at either product or feature level, meaning the metrics you choose will vary depending on what your goals are.
But, to give you something concrete to work off, here are some examples of metrics you could use for each of the different dimensions of the HEART UX Metrics framework.
Happiness: How happy are users with the overall experience?
- Net Promoter Score (NPS): Measures how likely users are to recommend a product or service to others.
- Customer Satisfaction Score (CSAT): Measures how satisfied users are with a specific aspect of the product or service.
- User sentiment analysis: Analyzes user feedback and sentiment to determine how users feel about the product or service.
Engagement: How engaged are users with the site or app?
- Time on Site: Measures how long users stay on the site or app.
- Click-Through Rate (CTR): Measures how often users click on links or buttons on the site or app.
- Pageviews per Session: Measures how many pages users visit in a single session.
Adoption: How effectively are users able to start using the site or app?
- Signup Conversion Rate: Measures the percentage of users who complete the signup process.
- Onboarding Completion Rate: Measures the percentage of users who complete the onboarding process.
- Time to First Key Action: Measures how long it takes users to perform a key action on the site or app, such as making a purchase or submitting a form.
Retention: How well is the site or app retaining users over time?
- Monthly Active Users (MAU): Measures the number of users who engage with the site or app on a monthly basis.
- Churn Rate: Measures the percentage of users who stop using the site or app over a certain period of time.
- User Retention Rate: Measures the percentage of users who return to the site or app after their first visit.
Task Success: How successful are users in completing tasks on the site or app?
- Conversion Rate: Measures the percentage of users who complete a specific task, such as making a purchase or submitting a form.
- Error Rate: Measures the percentage of errors users encounter while completing a task.
- Task Completion Time: Measures how long it takes users to complete a specific task on the site or app.
Using these examples as inspiration, spend some time thinking through your own project to determine which metric means the most to you. Think about what goals you want to achieve and decide which metrics will give you actionable data that can help you improve the product in the future.
In the next section, I outline a 3 step process that you can work through with your team to identify your specific user goals and define some concrete metrics to track after you launch your product.
The 3-Step Process to Nailing Your Own UX Metrics
This 3 step process will help you to identify your goals, decide on which signals indicate you’re heading in the right direction, and finally decide which metrics to track over time.
This should be a collaborative process with your team and stakeholders. It’s important that everyone buys into these metrics and that there’s a plan in place for tracking them and reporting on the results.
Remember that everything is iterative, so while it’s important to establish useful metrics that provide us value, as you gain experience through trial and error, don’t be scared to change the framework based on your own experiences.
This 3 step process will help you to identify your goals, decide on which signals indicate you’re heading in the right direction, and finally decide which metrics to track over time.
These steps are based on the goals-signals-metrics framework developed by the researchers at Google. It consists of three components: goals, signals, and metrics. Goals are the desired outcomes of a project or product, signals are the events or behaviors that indicate progress toward those goals, and metrics are the specific measurements used to track progress and assess success.
The beauty of this framework is that it encourages debate and conversation, as it requires stakeholders to clearly define the goals of the project or product and identify the signals and metrics that will be used to measure progress toward those goals. It allows for a collaborative approach to measuring success and ensures that everyone is working towards the same outcomes.
While the goals-signals-metrics framework is a valuable tool, it is important to note that it should not be followed blindly. Every project and product has unique needs and requirements, and some parts of the framework may not be relevant or necessary in certain situations.
Step 1: Define Goals
Here’s a quick overview of what’s involved during this step:
- Identify the goals you want to achieve through your user experience.
- Be specific, measurable, and actionable in defining your goals.
- Use the HEART framework to guide your goal-setting process.
Setting clear goals is critical. If you have vague goals or they aren’t meaningful to you, then you can’t possibly identify useful metrics.
The goal of a user experience should be specific, measurable, and actionable.
The goals you identify for each dimension of the HEART framework should align with the overall goal of the business or product as well as the user’s goal and the problem you’re trying to solve.
A goal in this context answers the question:
- What do we want to achieve with this product, feature, or user experience?
To answer this question, you need to consider:
- What problem are we trying to solve?
- Who is the target audience or user?
- What value does our product offer to users?
- What impact will this have on the lives of our users?
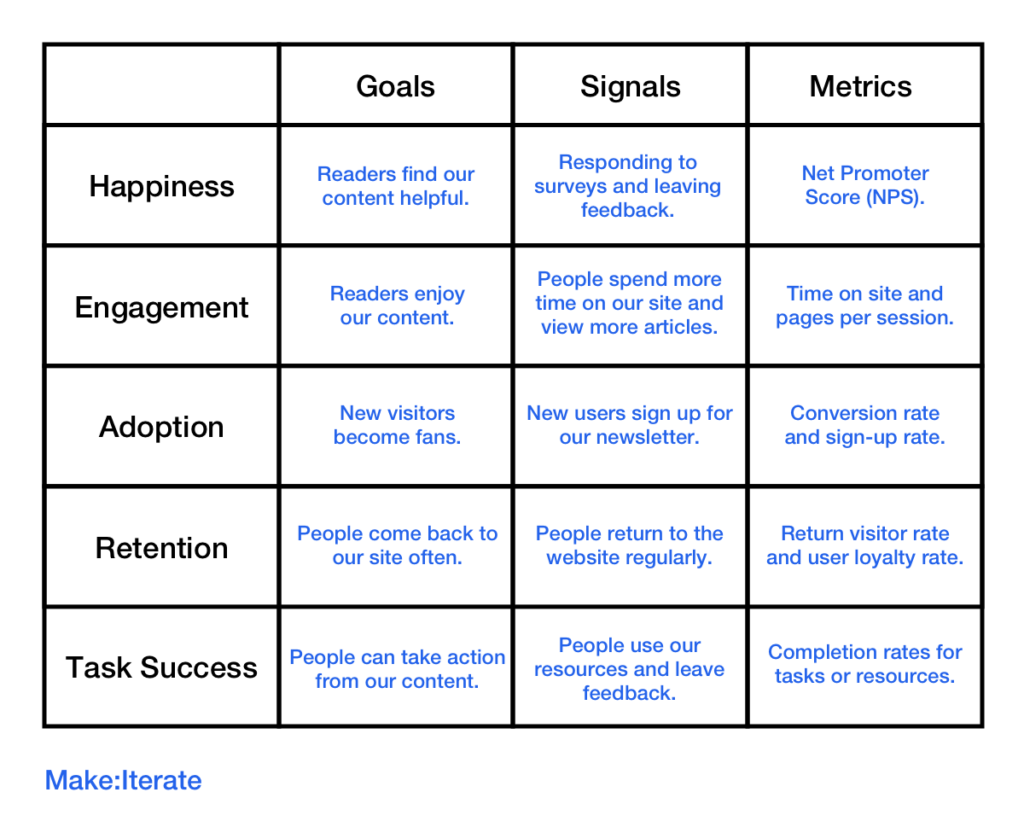
Some specific examples of goals based on Make:Iterate could be:
- Happiness: Readers find our content helpful.
- Engagement: Readers enjoy our content.
- Adoption: New visitors become fans.
- Retention: People come back to our site often.
- Task success: People can take action from our content.
It’s important that you define goals in a way that allows for meaningful measurement. Goals should be specific, measurable, and achievable. They should also be relevant to the project in question and aligned with the team’s overall objectives.
Clear goals help to identify the specific aspects of the user experience that need improvement and guide the collection and analysis of relevant data.
Once you have a clear understanding of what your goals are and how you define success, you can move on to the next step.
Step 2: Identify Signals
Here’s a quick overview of what’s involved during this step:
- Identify the signals that will help you track progress towards your goals.
- Use user research and data analysis to identify relevant signals.
- Use the HEART framework to guide your signal identification process.
Once clear goals have been established, the next step in measuring UX metrics is to identify signals.
To measure UX metrics, identify the signals that indicate progress toward the goals.
This involves looking at user research and data analysis to identify the types of events or behaviors that indicate progress toward the goals.
Signals can be anything from user actions (e.g., clicking on a button, submitting a form) to market indicators (e.g., sales numbers, customer satisfaction ratings).
The key is to identify the signals that are most relevant to your specific goals.
To identify your own signals, consider these questions:
- What types of user behaviors indicate progress toward our goals?
- Are there any market indicators that can be used to measure success?
- Are there any user journey or task completion metrics that can be used?
Some specific examples of signals for each dimension of the HEART framework could be:
- Happiness: Responding to surveys and leaving feedback.
- Engagement: People spend more time on our site and view more articles.
- Adoption: New users sign up for our newsletter.
- Retention: People return to the website regularly.
- Task Success: People use our resources and leave feedback.
To identify signals that can be used to track progress toward UX goals, businesses should look for data points that are both measurable and actionable.
By tracking these signals over time, businesses can identify trends and patterns that provide insights into the effectiveness of the user experience.
Step 3: Choose Metrics
Here’s a quick overview of what’s involved during this step:
- Choose specific metrics that can be used to measure your signals.
- Ensure your metrics are specific, measurable, and actionable.
- Use the HEART framework to guide your metric selection process.
Once signals have been identified, the next step in measuring UX metrics is to choose specific metrics that can be used to track progress toward achieving the identified signals.
Metrics are quantitative measurements that are used to evaluate the performance of specific aspects of the user experience.
When choosing metrics, it is important to select ones that are directly relevant to the signals being tracked.
To choose useful metrics, ask yourself:
- What metrics will help us track progress toward our goals?
- Which metrics are most actionable and useful?
- Are there any existing metrics that can be used?
Here’s a specific example of what metrics we could choose for Make:Iterate:
- Happiness: Net Promoter Score (NPS).
- Engagement: Time on site and pages per session.
- Adoption: Conversion rate and sign-up rate.
- Retention: Return visitor rate and user loyalty rate.
- Task Success: Completion rates for tasks or resources.
By selecting metrics that are specific, measurable, and actionable, you can gain real insights into the effectiveness of your UX design.
Actionable Tips for Implementing the HEART Framework
- Work with a cross-functional team: Involve a cross-functional team in the implementation process, including UX designers, the product manager, developers, and data analysts. This will ensure that everyone has a stake in the process and can provide valuable input.
- Keep your goals up to date and check they’re useful: Regularly review and update your goals, signals, and metrics to ensure they remain relevant and effective. As your product or service evolves, so should your metrics.
- Take data from multiple sources: Use multiple sources of data to validate your metrics and track progress towards your goals. This can include data from your website or app analytics, surveys, user testing, and other sources.
- Don’t rely solely on the HEART Framework: Don’t rely solely on the HEART framework – use it along with other UX research methods to get a well-rounded understanding of the usability aspects of your user experience. This’ll give you a more complete picture of how users are interacting with your product or service.
- Consult with technical people who can help you implement tracking: Have a plan for implementing the tracking, including which metrics you will track, how you will collect the data, and how often you will review it.
- Remember to report regularly on progress: Have a plan for monitoring progress and reporting on the results. Include regular check-ins with your team or stakeholders, as well as reports or dashboards to track progress over time.
- Think about what impact you want to have on people’s lives: Think about your specific goals in terms of how they’ll positively impact user’s lives. What signal will tell you that you’re achieving these goals, and how can you use this information to make meaningful improvements to the user experience?
- Iterate, iterate, iterate: Remember everything is iterative, do your best to get up and running and improve the metrics over time as you gain more experience.
- Reflect, learn, and improve: Have a quarterly retro to review your metrics and determine if they’re still useful. Use this opportunity to brainstorm new metrics or adjust your existing ones based on your learnings.
Where does the Google HEART Framework Come From?
The HEART framework was originally introduced in a 2013 report by Google researchers Kerry Rodden, Hilary Hutchinson, and Xin Fu.
The article, titled “Measuring the User Experience on a Large Scale: User-Centered Metrics for Web Applications,” outlined the framework as a way to help teams measure and improve the usability and user experience of web applications after launch.
Google created the HEART framework as a response to the limitations of traditional web analytics tools, which tend to focus on quantitative measures. The HEART framework was designed to help teams measure more qualitative aspects of the user experience, like user engagement and satisfaction.
The framework is made up of five dimensions: Happiness, Engagement, Adoption, Retention, and Task Success, each of which is measured using specific metrics. The original article includes detailed descriptions of each dimension and recommended metrics for measuring them.
Since its introduction, the HEART framework has been widely adopted by UX researchers and designers, both within and outside of Google. It has been used to measure and improve the user experience of a wide range of digital products and services.
If you want to learn more about the HEART framework, read the original article by Kerry Rodden, Hilary Hutchinson, and Xin Fu.
Key Takeaways
- UX KPI’s and usability are notoriously difficult to track after launch. Finding the right UX metrics and User centered metrics like user satisfaction, user attitude, and the perceived ease of use can be more difficult to track on a quant scale.
- The UX Metrics Heart framework is designed to help the UX team and product team choose the right metrics that give a useful view of usability and user behavior to help them make better UX decisions.
- This is done through the goals signals metrics process that helps us by setting goals, identifying what user behavior indicates we’re on track to success, and then defining which UX metrics to track.
- This data should help us to make UX changes and monitor the customer experience to help us improve the digital product in future iterations and help us hit our product goals.
- The framework guides us through setting goals for a happiness metric, engagement, user adoption, retention and task success.